Designing Responsibly: Best Practices for ESG Content
Written By
Imagine that you’re a business searching for a sustainable supplier of job materials. Or an employee looking for a workplace where you’ll be valued and respected. Or a prospective investor seeking reassurance of a company’s responsibility. You’d be the prime audience for an organization’s ESG report.
What Is ESG Reporting, and Why Is It Important?
You’re probably already familiar with annual reports, which disclose financial information and summarize a company’s achievements for the year. An ESG report takes a similar form—and may be integrated into an annual report—but summarizes an organization’s environmental, social, and governance (ESG) impact.
Environmental factors may include ways that your company reduced carbon emissions, supported biodiversity, or diverted waste. Social issues may include your efforts to cultivate diversity, improve safety and workplace conditions, or volunteer in the communities where you work. Reporting on governance may include a profile of your corporate board and committees, descriptions of your policies and internal controls, and ways you engage shareholders.
While ESG reporting is still largely voluntary, it is increasingly important to shareholders of public companies, clients selecting who they work with, and customers choosing products and services. In 2020, 92% of companies in the S&P 500 published an ESG or sustainability report. In the eyes of investors, corporate responsibility and transparency correlates with lower risk, making ESG reports both useful to readers and strategic for your organization.
Function Before Form: Gathering Content
The most beautiful report in the world is only as good as its content. Before you involve designers, consider how you can make your content meaningful, consequential, and relevant:
- Define your target audience. Is it shareholders? Potential investors? Clients? Current employees? Prospective ones? It’s likely some mix of all of the above, but ranking your audiences can help you prioritize essential content. Don’t forget your competitors and industry partners. Especially if ESG reporting in your industry is in the nascent stages, you can pioneer the benchmarks for others and stand apart as a champion of corporate responsibility in your field.
- Establish a theme. Did your organization conquer an ESG challenge? Did you lead a major initiative that can set the tone? While some of your reporting will be general from year to year, a theme provides a narrative arc to make your report more engaging and focused.
- Start early. If you develop a theme, announce it to your employees so your teams can synchronize their content throughout the year. It takes some back-and-forth to get the necessary verbiage, media, and sources, so consider collecting ESG information from your departments or subsidiaries on a rolling or quarterly basis to avoid the rush.
- Catalog your achievements. Develop high-quality media to support your report. Hire professional photographers, videographers, and copywriters to document noteworthy projects, or engage a creative agency to do so for you.
- Crowd-source sustainability data. Carimus recently acquired JouleBug, an app that lets employers run challenges to encourage employees to improve their sustainability and wellness habits. The app tracks carbon emissions offset, water saved, and other metrics, allowing employees to contribute to an organization’s ESG goals.
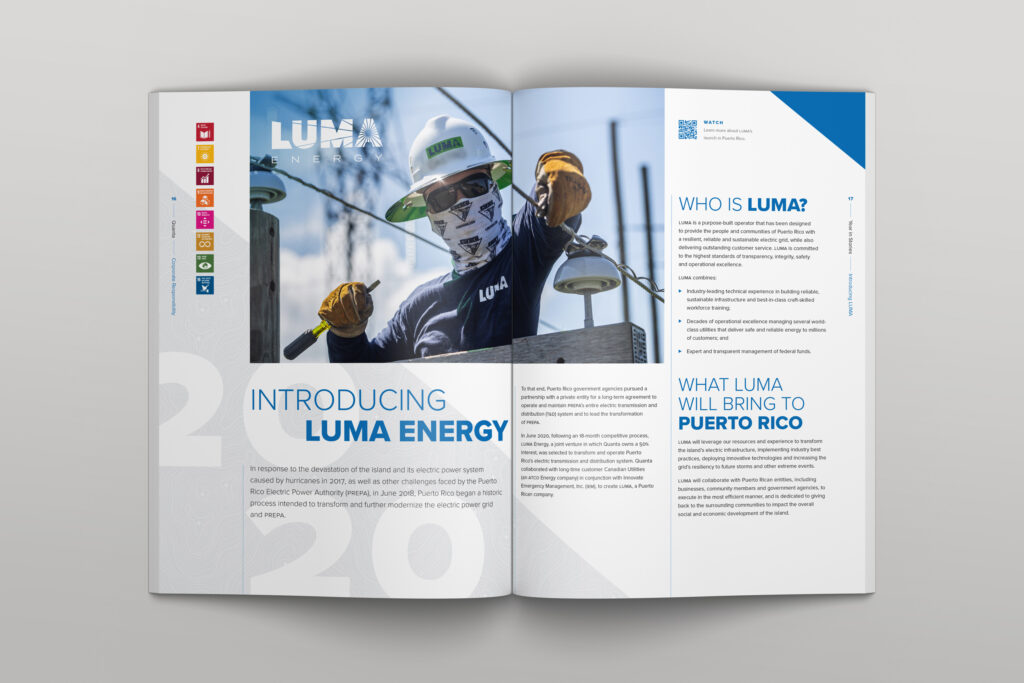
- Adopt an ESG framework. Do you already use an ESG reporting software or dashboard? Can you connect your projects to the UN Sustainable Development Goals (SDGs)? Using a recognized framework (or two) can lend credibility to your reporting. Besides the SDGs, some common standards include the Global Reporting Initiative (GRI), Sustainability Accounting Standards Board (SASB), and Task Force on Climate-Related Financial Disclosures (TCFD).
- Make it count. Ensure that your statistics are above reproach and can be verified and substantiated. Audit your figures internally or externally. Don’t pad copy with purple prose, weasel words, or filler. If you don’t have enough content for a full-length report, introduce ESG reporting incrementally by adding a section to your annual report or creating a condensed or tearsheet version.

Structuring Content for Publication
Once you’ve gathered content, create features to pique interest and sustain deep reading.
Offer a Snack Before the Main Course
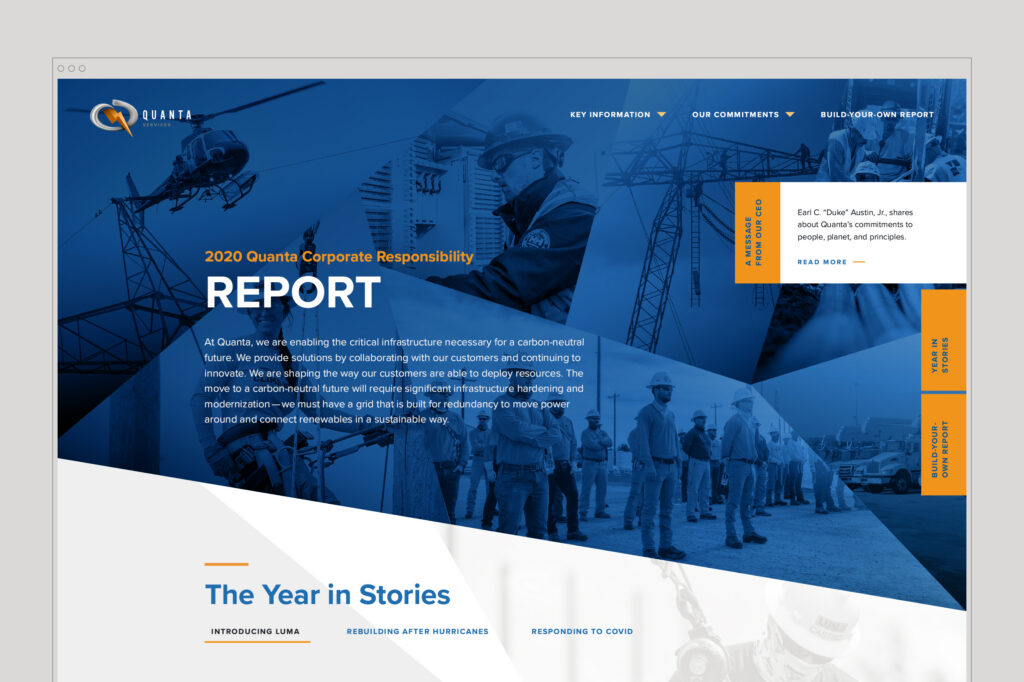
The beginning of a publication serves as an appetizer for the rest of the content. Think of your favorite magazine: before the long articles, it probably has sections with recurring columns, letters from the editor, and lots of highly-visual short features and teasers organized by topic. Your ESG report can use a similar format to hook readers and invest them in the longer-form content that follows.
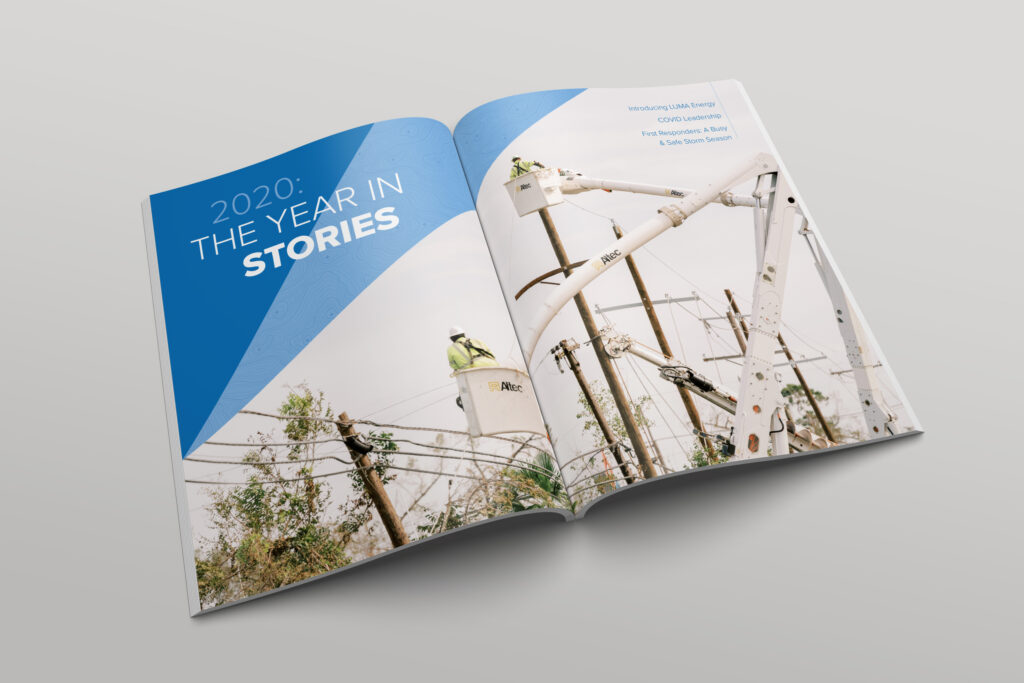
Did your organization have a particularly news-worthy year? Consider a “Year-in-Review” with photos and short blurbs about major events, acquisitions, or accomplishments.
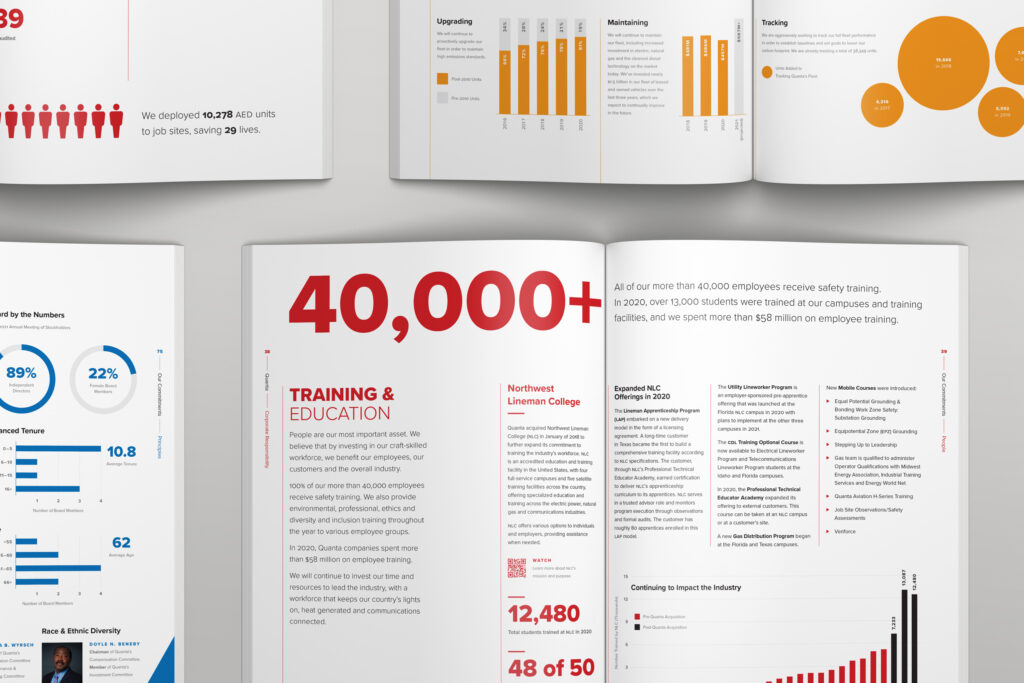
Did you surpass the ESG benchmarks you set in the previous year? Highlight your performance by making your data visual with graphs and charts, and include “Looking Ahead” sidebars to describe future goals and indicate your proactive commitment to raising the bar.
Or consider a deep survey of your initiatives for just one aspect of ESG.
If the rest of your ESG content is more dry, tabular, and quantitative, this is a chance to humanize your narrative and add color, figuratively and literally. More importantly, this is an opportunity to show readers that your commitments to responsibility are not just token or obligatory, but are crucial to your corporate identity.
Design for Different Reading Modes & Attention Spans
Make sure your content supports different types of browsing: the initial hook, light reading, and deep reading. Each of these types of content funnels the reader’s attention into the next level of reading. The hook is whatever instantly catches the eye: headlines, photos, and splashy graphics. This content must be intriguing and striking to persuade readers to dive into light reading, which includes decks (the short sentence under a headline that describes the article), sidebars, subheadings, captions, and smaller graphics. Deep reading is your long-form text.
In addition to encouraging readers to jump into deep reading, light reading lends variety to the page and breaks up blocks of text that might otherwise be fatiguing. Consider adding the following to your ESG report:
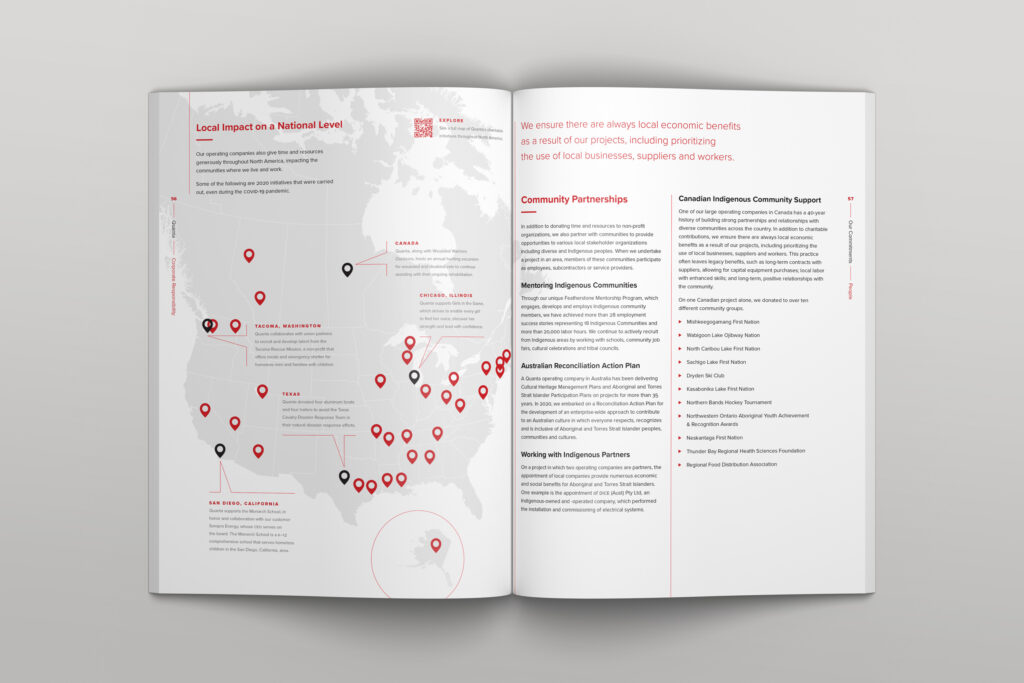
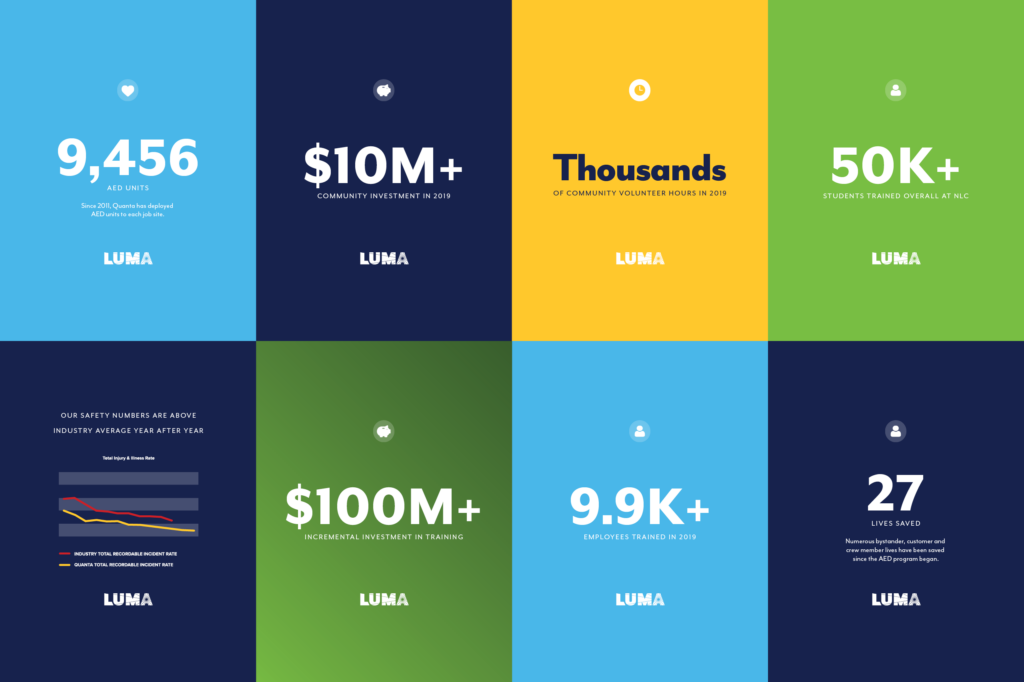
- Instead of using tables, visualize your data with infographics, such as bar, line, and pie charts; maps; diagrams; and timelines.
- Use by-the-numbers features to highlight important stand-alone statistics, like number of employees trained, tons of carbon offset, or total charitable donations.
- For slightly longer content, use callouts to showcase “fast facts” about your organization and ESG accomplishments.
- Sidebars are stories within stories. Use them to expand on noteworthy topics or ESG processes and policies that might otherwise get lost (or be distracting) in the main text.
- Use pull quotes to excerpt the most compelling quotes or important information in an article.
- Use digital features, like links or QR codes, to push readers to videos or more in-depth content on your website or ESG site.
In addition to guiding readers to deeper and deeper content, use transitional sections to control pacing and help readers navigate. For example, before text- or statistic-heavy descriptions of your ESG initiatives, add a photo-heavy spread with a section title and a short description of your reporting frameworks. Like the light-reading content listed above, transitions help break up long, potentially-fatiguing content.
By being mindful of your audience, developing meaningful data and media, and employing a wide variety of content types, you can create an ESG report that reads like a magazine instead of a spreadsheet.
Deliver to a Digital World
Take advantage of multiple digital channels to enhance your ESG narrative and increase exposure and engagement.
An ESG website deepens a reader’s understanding by allowing them to explore multimedia—interviews and testimonials, animations of technical processes, interactive infographics, and more—alongside text content. The web version can augment (or even stand in for) print, PDF, and e-book versions.
Harness social media to promote connection and community. Bite-sized content—pull quotes, photos, and animations—can entice your followers to read and share your ESG report. Get in front of the right audience with targeted ads and boosted content on social channels like Facebook or LinkedIn.
You’ve worked hard to make a real ESG impact, gather stories and metrics, and compile your efforts into a beautiful report. A thoughtful content marketing plan can maximize its reach and transform your ESG report from a once-a-year disclosure to a year-round priority.
Need help wrapping your hands around ESG communication at your company? We got you covered!
“What I love about the culture at Carimus is that it thrives on a foundation of passion and excellence, where every individual is not just an employee but a valued contributor to our shared success story.
”
Looking beyond your own horizons?
Ready when
you are.
Blog & Posts